Code
import matplotlib.pyplot as plt
import ayto
fig, ax = plt.subplots(figsize=(8, 4.2))
ayto.plot_probability_versus_n_correct(ax)
plt.show()Using derangements and the “Are You The One” matching game to work out the odds of getting every couple right.
Kyle Arean-Raines
July 24, 2026
A few years ago I was introduced to the reality dating show Are You The One. Aside from being drama-filled, quality television, it also had an interesting probability component.
I decided to do some calculations, and eventually posed a problem on r/mathriddles, the text of which I’ll quote here:
There are 10 male contestants and 10 female contestants. Prior to the start of the show, a “matching algorithm” pairs people according to supposed compatibility. There are 10 such matches, each a man matched with a woman, and none of the contestants know which pairings are “correct” according to the algorithm.
Every episode there is a matching ceremony where everyone matches up with someone of the opposite gender. After everyone finds a partner, the number of correct matches is revealed [à la Mastermind]. However, which matches are correct remains a mystery. There are 10 such ceremonies, and if the contestants can get all 10 matches correct by the tenth ceremony they win a prize.
There is another way they can glean information, called the Truth Booth, which greatly increases their odds. But I’ll leave this part out for the sake of this problem.
Onto the problem:
The first matching ceremony just yielded N correct matches. In the absence of any additional information, and using an optimal strategy (they’re trying to win), what is the probability that they will get all 10 correct on the following try?
If you’re familiar with probability theory, particularly combinations and permutations with fixed points, you may be able to solve this. It’s pretty tricky! I had to look something up to get the final result.
Here’s a hint. Given a sequence of \(n\) objects, the total number of ways you can permute them where none of the objects were in their initial position - defined as \(D_n\) - is
\[ D_n = \left[\frac{n!}{e}\right] \]
where the brackets denote the closest integer to the inner term, \(n!/e\). Yes that’s \(e\) as in Euler’s number! It appears in so many different fields, and here it is in probability theory.
We’ll now work toward calculating the probability of getting none of the matches correct.
Imagine you line up all 10 women, each facing forward. Next choose some random ordering for the men. Each man will face one of the women, with some small probability that it’s their match. The point here is that we can encode a pairing of 10 couples by a single sequence if we fix the position of each woman for the whole calculation. So Susie is always first in line, then Esther, then Ethyl, then Methyl, etc. Shuffling (permuting) just the men can give all possible pairings. How many are there?
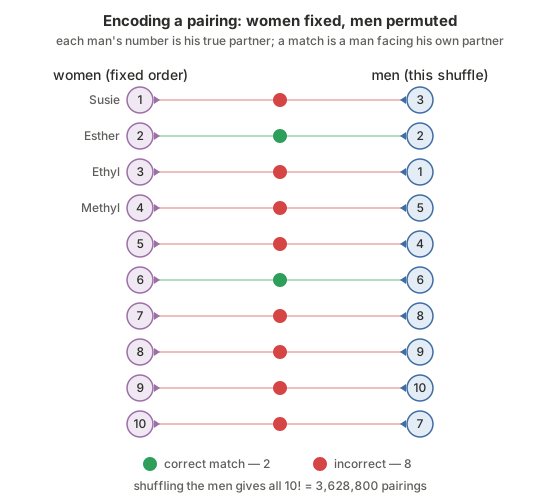
It’s the number of ways to permute 10 objects, or \(10!\) (factorial: 10 times 9 times 8… all the way to 1). Only one of these permutations contains all the correct matches. So the probability of getting it right with a random ordering is
\[ \frac{1}{10!} = \frac{1}{3628800} \approx 0.0000003 \]
giving a 0.00003% chance. That’s vanishingly small!
Exercise for the reader: can you get 9 out of 10 couples right? Why or why not?
Using the formula from before, the number of ways to get none of the matches correct is the number of permutations with none of them in their original (correct) spots:
\[ N(0) = D_{10} = \left[\frac{10!}{e}\right] = 1334961 \]
So the probability of getting none right is
\[ p(0) = \frac{N(0)}{10!} = \frac{\left[\frac{10!}{e}\right]}{10!} \approx .368 = 36.8\% \]
So you have a roughly 37% chance of getting none right, which means a 63% chance of at least one match! Kind of surprising that you’re more likely to get a match than not.
The next step is to calculate the probability of getting exactly N matches right. Starting with the number of ways to get exactly one couple right, it’s the number of ways to choose 1 couple among the 10 (there are 10 such ways) multiplied by \(D_9\) (9 couples left over, all must be incorrectly matched). Thus,
\[ p(1) = {10 \choose 1} \frac{\left[\frac{9!}{e}\right]}{10!} \approx .368 = 36.8\% \]
That’s the same answer we got above, to every digit that matters! Weird - so the probability of getting one match is (almost exactly) the same as the probability of getting no matches. In fact they’re not quite equal - using the exact series for \(D_n\), they differ by precisely \(\frac{1}{10!} \approx 0.0000003\), invisible at this precision - and the result barely depends on the size of the group. Both probabilities converge to \(e^{-1}\) as the group size grows, and they get there so fast that the answer would look identical even if there were 100 people being matched up.
Finally, we put it all together by generalizing - if we got \(N\) correct matches the previous round, we’ll want to take a guess at which \(N\) were correct and fix \(N\) couples for the next guess. The number of ways to choose \(N\) from a group of 10 couples then permute the rest with no correct matches is
\[ N(\mathrm{N}) = {10 \choose N}\left[\frac{(10 - N)!}{e}\right] \]
Given that we observed \(N\) correct, the true matching is equally likely to be any one of these \({10 \choose N}\left[\frac{(10 - N)!}{e}\right]\) permutations - we have no way to tell them apart. So the best we can do on the next guess is pick one of them, which means the probability of getting all of them correct after fixing \(N\) couples is just one divided by how many candidates are still in play:
\[ p(10 | N) = \frac{1}{ {10 \choose N}\left[\frac{(10 - N)!}{e}\right] } \]
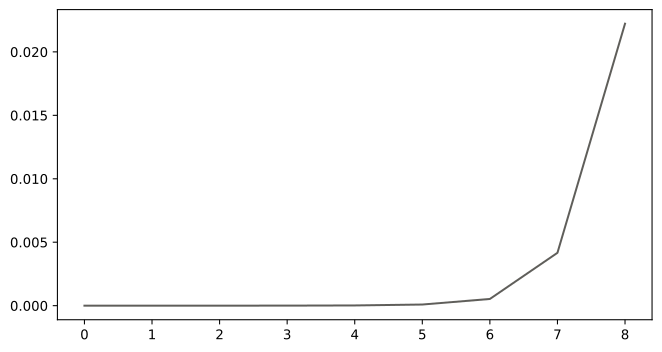
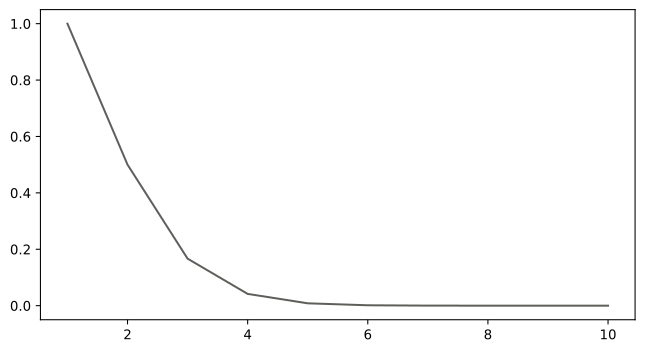
Finally-finally, we’ll do some plots, first of the probabilities for getting all 10 right given \(N\) correct matches; then the probabilities of getting all correct as a function of the size of the group.
The full source for this series is on GitHub. The derivations, code, and prose are all mine. However, I did consult Claude to proofread and for help setting up the project and rendering equations.
A weekly email if there's something new. No spam, unsubscribe anytime.
---
title: "Odds that you're the one"
description: >
Using derangements and the "Are You The One" matching game to work out the odds of getting every couple right.
date: 2026-07-24
author: "Kyle Arean-Raines"
categories: [probability, combinatorics, reality TV]
toc: true
bibliography: ../../references.bib
---
# Odds that you're the one
A few years ago I was introduced to the reality dating show [Are You The One](https://en.wikipedia.org/wiki/Are_You_the_One).
Aside from being drama-filled, quality television, it also had an interesting probability component.
I decided to do some calculations, and eventually posed a problem on `r/mathriddles`,
the text of which I'll quote here:
> There are 10 male contestants and 10 female contestants. Prior to the start of the show, a "matching algorithm" pairs
> people according to supposed compatibility. There are 10 such matches, each a man matched with a woman, and none of
> the contestants know which pairings are "correct" according to the algorithm.
>
> Every episode there is a matching ceremony where everyone matches up with someone of the opposite gender. After
> everyone finds a partner, the number of correct matches is revealed [à la Mastermind]. However, which matches are
> correct remains a mystery. There are 10 such ceremonies, and if the contestants can get all 10 matches correct
> by the tenth ceremony they win a prize.
>
> There is another way they can glean information, called the Truth Booth, which greatly increases their odds.
> But I'll leave this part out for the sake of this problem.
>
> Onto the problem:
>
>**The first matching ceremony just yielded N correct matches. In the absence of any additional information, and using
> an optimal strategy (they're trying to win), what is the probability that they will get all 10 correct on the
> following try?**
If you're familiar with probability theory, particularly combinations and permutations with fixed points, you may
be able to solve this. It's pretty tricky! I had to look something up to get the final result.
Here's a hint. Given a sequence of $n$ objects, the total number of ways you can permute them where none of the
objects were in their initial position - defined as $D_n$ - is
$$
D_n = \left[\frac{n!}{e}\right]
$$
where the brackets denote the closest integer to the inner term, $n!/e$.
Yes that's $e$ as in Euler's number! It appears in so many different fields, and here it is in probability theory.
## Step 1
We'll now work toward calculating the probability of getting none of the matches correct.
Imagine you line up all 10 women, each facing forward. Next choose some random ordering
for the men. Each man will face one of the women, with some small probability that it's their match. The point
here is that we can encode a pairing of 10 couples by a single sequence if we fix the position of each woman for the
whole calculation. So Susie is always first in line, then Esther, then Ethyl, then Methyl, etc. Shuffling (permuting)
just the men can give all possible pairings. How many are there?

It's the number of ways to permute 10 objects, or $10!$ (factorial: 10 times 9 times 8... all the way to 1). Only one of
these permutations contains all the correct matches. So the probability of getting it right with a random ordering is
$$
\frac{1}{10!} = \frac{1}{3628800} \approx 0.0000003
$$
giving a 0.00003% chance. That's vanishingly small!
Exercise for the reader: can you get 9 out of 10 couples right? Why or why not?
## Step 2
Using the formula from before, the number of ways to get none of the matches correct is the number
of permutations with none of them in their original (correct) spots:
$$
N(0) = D_{10} = \left[\frac{10!}{e}\right] = 1334961
$$
So the probability of getting none right is
$$
p(0) = \frac{N(0)}{10!} = \frac{\left[\frac{10!}{e}\right]}{10!} \approx .368 = 36.8\%
$$
So you have a roughly 37% chance of getting none right, which means a 63% chance of at least one match!
Kind of surprising that you're more likely to get a match than not.
## Step 3
The next step is to calculate the probability of getting exactly N matches right. Starting with
the number of ways to get exactly one couple right, it's the number of ways to choose 1 couple among the 10
(there are 10 such ways) multiplied by $D_9$ (9 couples left over, all must be incorrectly matched). Thus,
$$
p(1) = {10 \choose 1} \frac{\left[\frac{9!}{e}\right]}{10!} \approx .368 = 36.8\%
$$
That's the same answer we got above, to every digit that matters! Weird - so the probability of getting one
match is (almost exactly) the same as the probability of getting no matches. In fact they're not *quite*
equal - using the exact series for $D_n$, they differ by precisely $\frac{1}{10!} \approx 0.0000003$, invisible
at this precision - and **the result barely depends on the size of the group.** Both probabilities converge
to $e^{-1}$ as the group size grows, and they get there so fast that the answer would look identical even if
there were 100 people being matched up.
## Step 4
Finally, we put it all together by generalizing - if we got $N$ correct matches the previous round,
we'll want to take a guess at which $N$ were correct and fix $N$ couples for the next guess. The number of ways
to choose $N$ from a group of 10 couples then permute the rest with no correct matches is
$$
N(\mathrm{N}) = {10 \choose N}\left[\frac{(10 - N)!}{e}\right]
$$
Given that we observed $N$ correct, the true matching is equally likely to be any one of these
${10 \choose N}\left[\frac{(10 - N)!}{e}\right]$ permutations - we have no way to tell them apart. So the best we can
do on the next guess is pick one of them, which means the probability of getting all of them correct after fixing
$N$ couples is just one divided by how many candidates are still in play:
$$
p(10 | N) = \frac{1}{ {10 \choose N}\left[\frac{(10 - N)!}{e}\right] }
$$
## Step 5
Finally-finally, we'll do some plots, first of the probabilities for getting all 10 right given $N$ correct matches;
then the probabilities of getting all correct as a function of the size of the group.
```{python}
#| label: fig-schematic
#| fig-cap: "Probability of getting all correct after N correct in the previous round."
#| code-fold: true
import matplotlib.pyplot as plt
import ayto
fig, ax = plt.subplots(figsize=(8, 4.2))
ayto.plot_probability_versus_n_correct(ax)
plt.show()
```
```{python}
#| label: fig-schematic-2
#| fig-cap: "Probability of getting all correct for a group of size N."
#| code-fold: true
import matplotlib.pyplot as plt
import ayto
fig, ax = plt.subplots(figsize=(8, 4.2))
ayto.plot_probability_of_all_versus_n(ax)
plt.show()
```
The full source for this series is on
[GitHub](https://github.com/kareanra/physics-blog).
The derivations, code, and prose are all mine. However, I did consult Claude to proofread and for help
setting up the project and rendering equations.